Pakistan Textile Exports Rise 5.26% to $5.03 Billion in Q1 FY27 — Garments Lead the Charge
Pakistan’s textile and clothing exports grew 5.26 percent year-on-year to USD 5.026 billion in the July–September quarter of fiscal year 2026-27, according to foreign trade data released by the Pakistan Bureau of Statistics (PBS). That compares with USD 4.775 billion in the same three months last year — roughly a quarter of a billion dollars…

Pakistan’s textile and clothing exports grew 5.26 percent year-on-year to USD 5.026 billion in the July–September quarter of fiscal year 2026-27, according to foreign trade data released by the Pakistan Bureau of Statistics (PBS). That compares with USD 4.775 billion in the same three months last year — roughly a quarter of a billion dollars of extra export revenue for the industry that remains the backbone of Pakistan’s export economy.
The headline number hides a split picture: readymade garments surged while several traditional categories shrank, input costs kept climbing, and exporters are openly warning that the second quarter could be worse unless the government acts. Below is the full category breakdown, what drove the growth, what is holding it back, and what it means for the trade balance.
The headline numbers at a glance
| Indicator | Q1 FY27 (Jul–Sep 2026) | Q1 FY26 | Change |
|---|---|---|---|
| Textile & clothing exports | USD 5.026 billion | USD 4.775 billion | +5.26% |
| Readymade garments (value) | USD 1.223 billion | USD 1.057 billion | +15.69% |
| Readymade garments (quantity) | — | — | +17.38% |
| Knitwear | USD 1.483 billion | USD 1.42 billion | +4.14% |
| Bedwear | USD 852.3 million | USD 852.867 million | −0.07% |
| Total merchandise exports | USD 8.445 billion | USD 7.599 billion | +11.13% |
| Total imports | USD 19.213 billion | USD 16.973 billion | +13.20% |
The pace matches what the sector managed just before the quarter closed: in July–August 2026 alone, textile exports had risen 5.55 percent to USD 3.379 billion. Steady growth, in other words — but not the double-digit jumps of better years.
Readymade garments: the clear bright spot
If there is one number exporters will quote in meetings with the commerce ministry, it is this: readymade garment exports jumped 15.69 percent in value to USD 1.223 billion (from USD 1.057 billion), while shipped quantities rose an even stronger 17.38 percent.
That combination matters. When volumes grow faster than values, it usually means exporters are winning orders on competitive pricing and reliability rather than riding a price wave. And garments are Pakistan’s best answer to the value-addition question that has haunted the sector for decades — a finished shirt earns several times more than the yarn or grey cloth it was cut from. The Q1 data suggests the shift toward finished goods is continuing, which is exactly the direction policymakers say they want.
Category scorecard: winners and losers
Performance varied sharply across product lines, per the PBS data:
| Indicator | Q1 FY27 value | Value change | Quantity change |
|---|---|---|---|
| Readymade garments | USD 1.223bn | +15.69% | +17.38% |
| Knitwear | USD 1.483bn | +4.14% | −0.46% |
| Cotton yarn | USD 227.1m | +24.47% | — |
| Towels | USD 291.56m | +10.00% | — |
| Made-up articles (excl. towels & bedwear) | USD 223.12m | +7.89% | — |
| Other textile materials | USD 133.15m | +3.91% | — |
| Bedwear | USD 852.3m | −0.07% | −0.71% |
| Cotton cloth | USD 425.3m | −5.34% | — |
| Art, silk & synthetic textiles | USD 91.17m | −7.01% | — |
| Other textile materials* | USD 178.17m | −6.31% | — |
| Yarn other than cotton yarn | USD 6.2m | −32.00% | — |
| Tents, canvas & tarpaulin | USD 25.7m | −35.29% | — |
*PBS reports two separate entries under “other textile materials” — one showing growth, the other a decline.
Cotton yarn posted the sharpest percentage gain of any major category — up 24.47 percent to USD 227.1 million — good news for the spinning mills of Punjab. Towels, another Pakistani specialty, rose a solid 10 percent to USD 291.56 million. On the other side, cotton cloth fell 5.34 percent to USD 425.3 million, continuing the long erosion of grey-fabric trade as buyers increasingly want finished goods, while bedwear slipped marginally in both value and quantity.
The headwind: rising costs vs rival countries
The familiar part of the story: exporters say rising production and input costs are steadily eroding Pakistan’s competitiveness against rival textile-producing countries — the Bangladesh, Vietnam, India and China that Pakistani mills compete with for every order.
The arithmetic is simple. Energy tariffs, financing costs and raw material prices feed directly into the per-unit cost of a shirt or a bedsheet, and a few cents per piece is often the difference between winning a seasonal program and watching it go to Dhaka or Ho Chi Minh City. Pakistani exporters argue regional competitors operate with cheaper energy, subsidized credit and smoother logistics — and that the cost gap keeps widening.
Context matters here. The full fiscal year 2025-26 closed with textile and clothing exports of just USD 17.93 billion — up a mere 0.26 percent for the entire year. Against that flat baseline, 5.26 percent is a genuine improvement. But it was achieved despite the cost headwinds, not because they were resolved.
Two setbacks weighing on the numbers
Beyond costs, two external shocks have directly dented shipments. First, the Afghanistan trade halt: commercial trade has remained suspended since October 2025, removing an export market worth nearly USD 1.5 billion at a stroke. Second, the Middle East slowdown: textile shipments to the region have declined amid the ongoing conflict, with the United Arab Emirates among the affected markets — painful for a sector that counts the Gulf as a steady buyer of home textiles and garments.
Together, these help explain why 5.26 percent — respectable on paper — feels modest to an industry that believes it should be growing much faster.
The warning: a Q2 slowdown is on the table
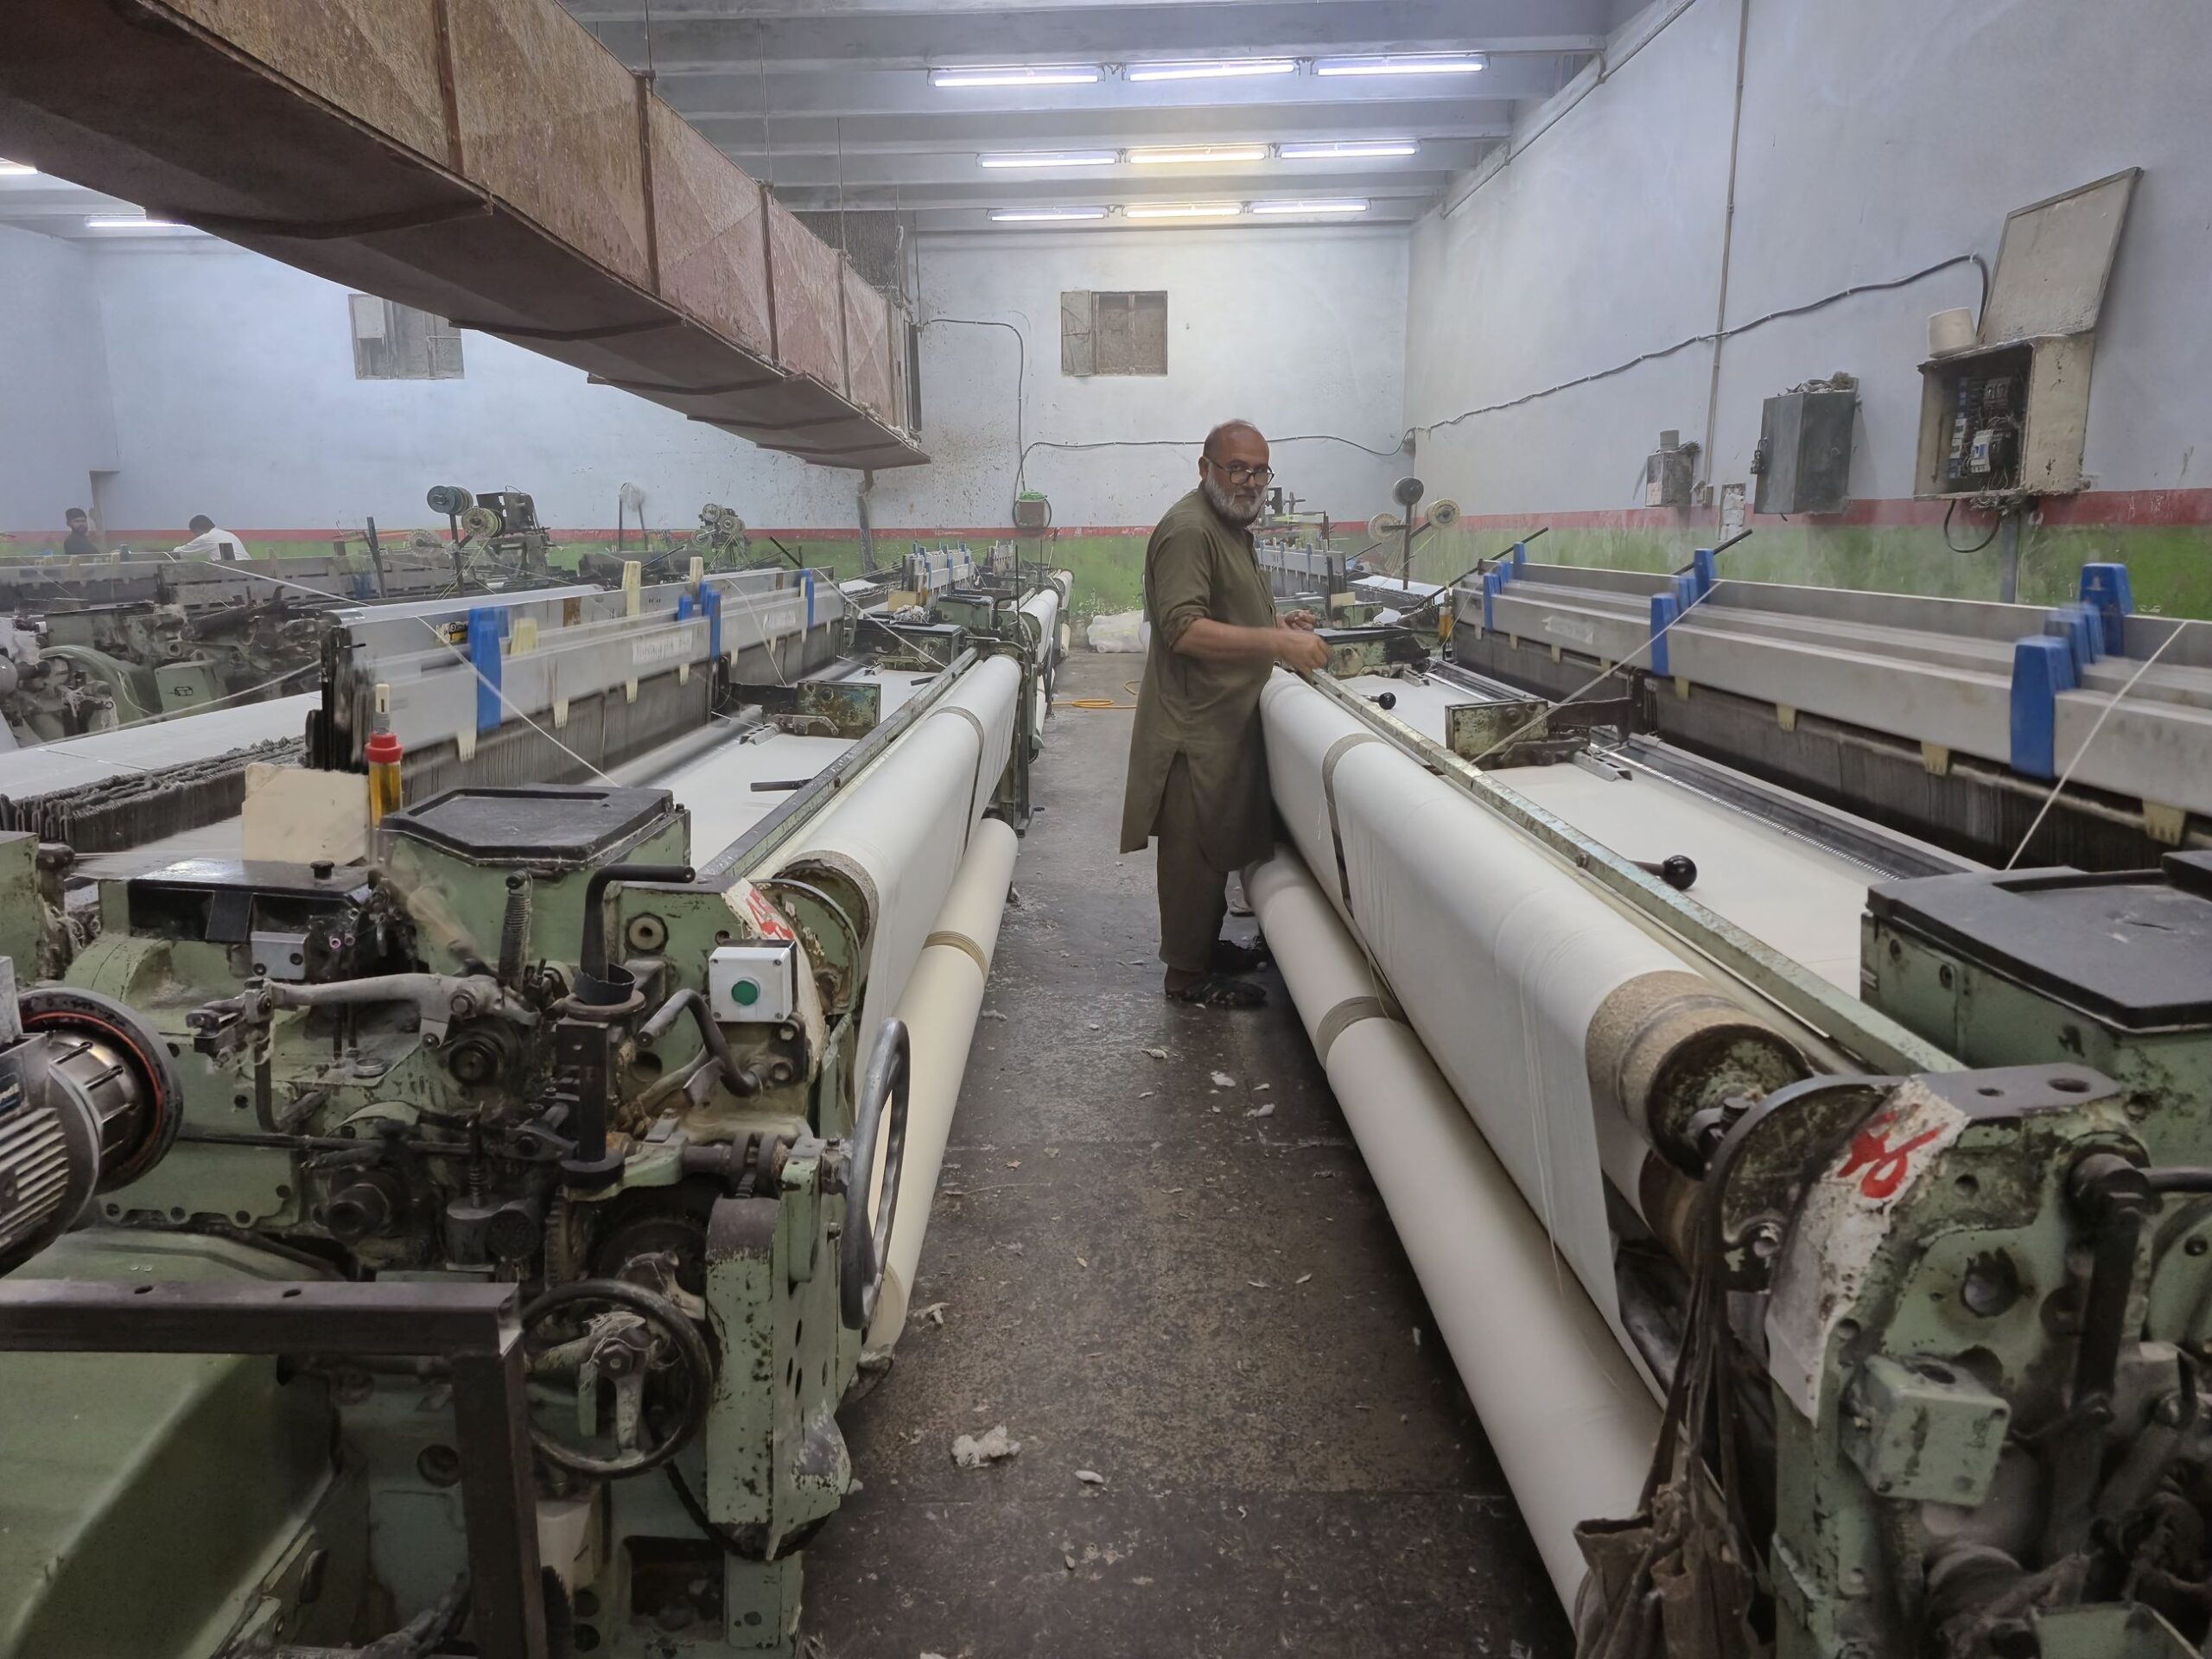
Exporters have warned the government that the sector could face a further slowdown in the second quarter unless immediate corrective steps are introduced. The industry’s wishlist has barely changed in a decade: competitive energy tariffs for export-oriented units, faster sales-tax refunds to ease working-capital pain, stable policy on export facilitation schemes for yarns and fabrics, and support for technology upgrades.
Whether the government — itself under tight fiscal constraints — can deliver any of this in the current quarter is the open question hanging over the sector. If the headwinds strengthen in Q2 while the easy year-on-year comparisons fade, the 5.26 percent could easily compress.
The bigger trade picture
Pakistan’s total merchandise exports rose 11.13 percent to USD 8.445 billion in July–September 2026 — meaning textiles, at USD 5.026 billion, still account for roughly three of every five export dollars the country earns. The less comfortable number: imports grew faster, up 13.20 percent to USD 19.213 billion, widening the merchandise trade deficit to USD 10.768 billion. Every extra dollar of textile exports matters precisely because the import bill keeps running ahead of it.
What this means for Pakistan
Textile export numbers can feel abstract, but they are not. The sector is the country’s largest industrial employer and its single biggest source of foreign exchange — when garment orders rise, factory shifts in Faisalabad and Sialkot run longer and the State Bank’s reserves get breathing room. The Q1 data gives cautious grounds for optimism: the value-added end of the industry is growing, which is structurally healthier than growth driven by raw yarn. But the exporters’ warning should be taken at face value — the October–December buying season will show whether this was a turning point or a pause.
Frequently asked questions
How much did Pakistan’s textile exports grow in Q1 FY27?
Textile and clothing exports grew 5.26 percent year-on-year to USD 5.026 billion in July–September 2026 (the first quarter of fiscal year 2026-27), versus USD 4.775 billion a year earlier, per Pakistan Bureau of Statistics data.
Which textile category performed best in July–September 2026?
Readymade garments: value up 15.69 percent to USD 1.223 billion, quantity up 17.38 percent. In percentage terms, cotton yarn grew fastest at 24.47 percent to USD 227.1 million; towels rose 10 percent to USD 291.56 million.
Which textile categories declined in Q1 FY27?
Cotton cloth fell 5.34 percent to USD 425.3 million, bedwear slipped 0.07 percent in value (0.71 percent in quantity), art/silk/synthetic textiles dropped 7.01 percent, non-cotton yarn plunged 32 percent, and tents/canvas/tarpaulin fell 35.29 percent.
What is hurting Pakistan’s textile exports?
Rising production and input costs eroding competitiveness against rival textile countries; the suspension of trade with Afghanistan since October 2025 (a market worth nearly USD 1.5 billion); and declining shipments to the Middle East, including the UAE, amid the ongoing regional conflict.
Are exporters worried about the next quarter?
Yes — they have warned the government of a possible Q2 (October–December 2026) slowdown unless immediate corrective steps are taken on energy costs, tax refunds and export facilitation.
How do textile exports fit into Pakistan’s overall trade?
Textiles (USD 5.026 billion) are roughly 60 percent of total merchandise exports (USD 8.445 billion, +11.13%) in Q1 FY27. Imports were USD 19.213 billion (+13.20%), leaving a trade deficit of USD 10.768 billion.
How did Pakistan’s textile exports perform in FY26?
Full-year 2025-26 textile and clothing exports were USD 17.93 billion — up just 0.26 percent — making the Q1 FY27 gain of 5.26 percent a notable pickup from a flat baseline.